PlotNado Documentation
  • Home
  • Getting Started
    • Installation
    • Quick Start
    • Track Construction
  • Examples
  • Guides
    • Track Catalog
    • Aesthetics
    • Figure Workflows
    • Recipes
    • Data Inputs
    • Best Practices
  • Reference
    • API Overview
    • Track Aliases
    • Template Schema
    • Compact Options
  • CLI
  • Help
    • FAQ
    • Troubleshooting
  • Changelog

On this page

  • First figure
  • Common routes
  • Two workflows
    • Python API
    • CLI + YAML
  • Edit this page
  • Report an issue

PlotNado

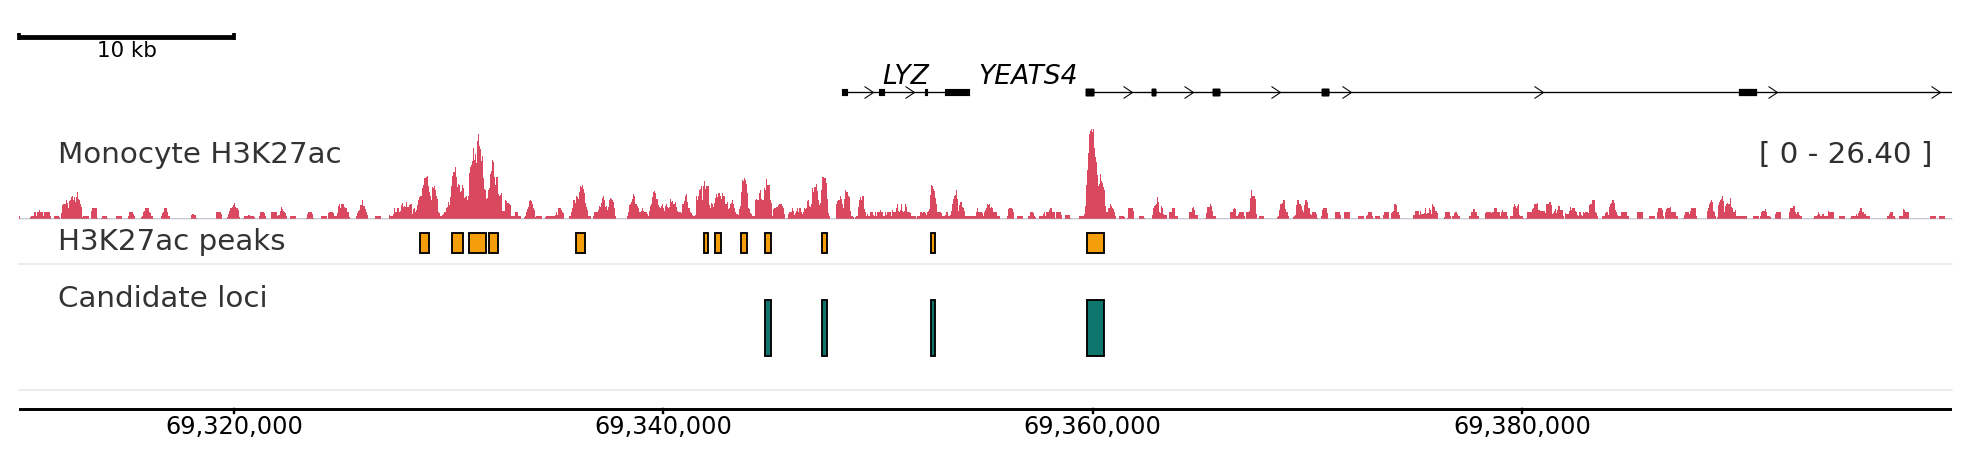
PlotNado builds genome browser-style figures from Python code or editable YAML templates. It is useful when you need reproducible plots for BigWig-like signals, intervals, peaks, links, genes, and optional matrix-style genomic data.

Start with Installation if you are setting up the project, or Quick Start if you already have the uv environment.

First figure

from pathlib import Path
import plotnado
from plotnado import GenomicFigure, PlotStyle

BLUEPRINT_MONOCYTE_BW = (
    "http://ftp.ebi.ac.uk/pub/databases/blueprint/data/homo_sapiens/GRCh38/venous_blood"
    "/C000S5/CD14-positive_CD16-negative_classical_monocyte/ChIP-Seq/NCMLS"
    "/C000S5H2.ERX173536.H3K27ac.bwa.GRCh38.20150529.bw"
)
BLUEPRINT_MONOCYTE_BB = (
    "http://ftp.ebi.ac.uk/pub/databases/blueprint/data/homo_sapiens/GRCh38/venous_blood"
    "/C000S5/CD14-positive_CD16-negative_classical_monocyte/ChIP-Seq/NCMLS"
    "/C000S5H2.ERX173536.H3K27ac.bwa.GRCh38.20150527.bb"
)
CANDIDATE_BED = str(
    Path(plotnado.__file__).parent.parent / "examples" / "data" / "blueprint_monocyte_lyz_candidate_peaks.bed"
)

fig = GenomicFigure(width=11, track_height=0.7, theme="publication")
fig.scalebar()
fig.genes("hg38", height=0.55)
fig.bigwig(
    BLUEPRINT_MONOCYTE_BW,
    title="Monocyte H3K27ac",
    style=PlotStyle.FRAGMENT,
    color="#d9485f",
    height=0.75,
    label_on_track=True,
    label_box_enabled=True,
    plot_scale=True,
)
fig.bed(BLUEPRINT_MONOCYTE_BB, title="H3K27ac peaks", color="#f59e0b", height=0.35, show_labels=False)
fig.bed(CANDIDATE_BED, title="Candidate loci", color="#0f766e", show_labels=True, label_field="name", font_size=7)
fig.axis()
fig.plot("chr12:69,310,000-69,400,000")

Common routes

Need Start here
Install from source or PyPI Installation
Build the first Python figure Quick Start
Infer and render YAML templates CLI
Choose a track type Track Catalog
Tune colors, labels, scaling, and styles Aesthetics
Debug blank plots or scale problems Troubleshooting

Two workflows

Python API

from plotnado import GenomicFigure

fig = (
    GenomicFigure()
    .scalebar()
    .bigwig(signal, title="Signal", style="fill")
    .bed(intervals, title="Intervals", display="expanded")
    .axis()
)
fig.save("plot.png", region="chr1:1,010,000-1,080,000")

Use this route in scripts, notebooks, analysis pipelines, and executable docs.

CLI + YAML

uv run plotnado init sample1.bw peaks.narrowpeak --auto --output template.yaml
uv run plotnado validate template.yaml
uv run plotnado plot template.yaml --region chr1:1,000,000-1,100,000 --output plot.png

Use this route when the figure definition should be reviewed or versioned as a human-editable YAML file.

For compact runtime lookup, use Compact Options.

  • Edit this page
  • Report an issue